Welcome! You may find that the most interesting posts were posted first, that is, at the bottom of the page, starting in June 2014.

March 28, 2016

Physical Units Factor Tables (PUFT)

PUFT Copyright 2014 - 2016 Enon Harris
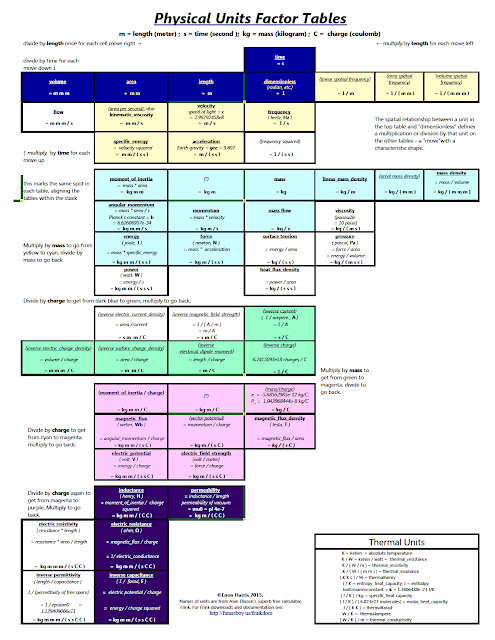
Physical Units Factor Tables (PUFT)

Link to full-size PUFT picture

[Edit: Link to PDF]

I drafted the Physical Units Factor Tables (PUFT) a bit over a year ago, and meant to send it off to publishers, as a poster chart for physics classrooms similar to the periodic table in chemistry classes. but I somehow never got around to it.

The Physical Units Factor Tables organize 50 types of physical units by their factors of length, time, mass and charge so that the mathematical  relationships between physical units are easy to see.

The Physical Units Factor Tables encourage anyone who can multiply and divide simple fractions to deduce equations in mechanics and electromagnetics .

The single-page  document is also marginally legible when printed in color on a single sheet of letter-size paper, but students and teachers with access to computers will likely find the electronic version easier on the eyes.

Each move left represents multiplication by length, each move down is division by time ( = multiplication by frequency). Similarly, moving right represents division by length and each move up represents multiplying by time. These factors are the same in all tables in the stack, with each lower table having an additional factor:
light blue table = * mass
green table       = * 1/charge
pink table         = * mass/charge
purple table      = * mass/charge^2

The names of the unit types are taken from Alan Eliasen's wonderful  calculator and physically-typed programming language, Frink. (Except for the ones whose top line is in parentheses; these names aren't listed in Frink, though it can easily compute using such quantities.)

The original was done in an Open Office spreadsheet, then saved as a PDF file. Among several other versions, I also have one that is more legible from a distance for use as a poster.

If any publishers or science teachers are interested in using PUFT, please let me know.
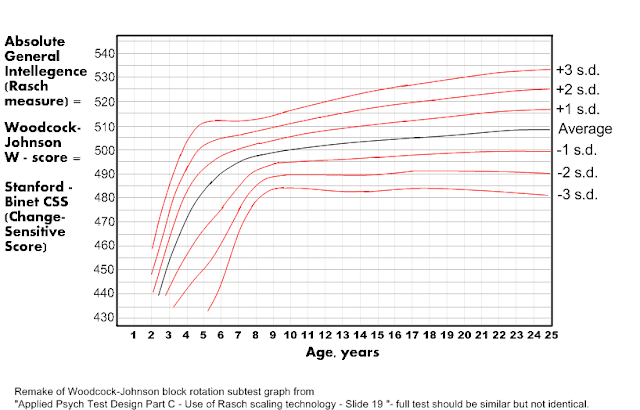
Converting IQ at a Given Age to an Absoloute (Rasch) Measure of Intelligence

Rasch measure of intelligence age 2-25 +/- 3 s.d. from the norming of the Woodcock-Johnson IQ test block rotation subtest . This is my remake with the scale changed to years, text replaced, and grid added from the source: Kevin McGrew slideshow  "Applied Psych Test Design: Part C - Use of Rasch scaling technology" Slide 19 (2009),  which had the original caption: Block Rotation: Final Rasch with norming test n = 37 norming items n = 4722 norm subjects Item map with “steps” displayed for items Red area represents the complete range (including extremes) of sample Block Rotation W- scores Good test scale coverage for complete range of population.

Rasch measures of intelligence are an interesting and important part of psychometrics, as they provide an absolute measure of intelligence, not only an "equal interval" scale (as with Fahrenheit and Celsius) but one with with a proper zero (as with Kelvin), also known as a ratio scale (not to be confused with the mental/chronological age ratio used in early IQ tests). Because it is a ratio measure, Rasch measures allow all arithmetic operations ( *,/,+,-, rather than at most + and - for IQ) and form the basis for item response theory (IRT) in general. (See the letter following this post for more.) Rasch measures also have the interesting property of putting item difficulties and test-taker abilities on the same scale, so that a if a person with a certain ability score tries an item with the same difficulty score, then he has a 50% chance of success.
  
The above graph was adapted from one used in the block rotation subtest norming of the Woodcock-Johnson IQ test (WJ), a product of Riverside Publishing, (a division of Houghton Mifflin Harcourt.) The Stanford-Binet (SB5), also published by Riverside uses the same scale ("change-sensitive" score or scale "CSS"), which has as its only arbitrary choice setting the CSS for an average 10-year old equal to 500.

The paper: Assessment Service Bulletin Number 3: Use of the SB5 in the Assessment of High Abilities, has on page 12 of the PDF (table 4) a reprint from the SB5 interpretive manual of the average full-scale CSS scores for diferent ages, which closely matches the average line in the graph above, so the block rotation subtest average scores vs. age should be a reasonable proxy for the full scale, (though there is reason to think the standard deviations on the WJ block rotation subtest shown in the graph are likely somewhat smaller than for the full scale score of the SB5). (See the end of this post for table 4 in usable form.) Unfortunately Riverside seems reluctant to publish the average age- vs. CSS or W-score graphs for either full test, let alone for different standard deviations, so using the BR subtest as a proxy for the full scale is as well as we can do.
  
Using a horizontal straightedge on the graph allows equating a given CSS score to z-scores at different ages. ( z-scores  = standard deviations, equivalent to 15 IQ points) The Mk.I eyeball gives a pretty decent estimate of fractional z-scores falling between the s.d. lines, but one can use the line or measurement tool in a decent paint program such as Paint.NET or Gimp to get better measurements of the z-score that equates to a given CSS at a given age. (Adding a T-square on a moveable transparent layer is also useful.) -  This allows comparing the absolute intelligence of people with different ages and z-scores.